Meteorological Data Portal
PCIC maintains databases containing observations of weather and climate variables (such as temperature and rainfall amounts) for various regions in Canada. At present there are two such databases:
- the Provincial Climate Data Set, or PCDS, containing data mainly from British Columbia and Alberta
- Yukon and Northwest Territories database, containing data from those regions
The Meteorological Data Portal (MDP) is an application that permits users to find and download data from these observational databases. A separate instance of the MDP serves data for each separate database. The MDP functions nearly identically for each database.
In the MDP, locations of observation stations are shown on an interactive map of the region, which enables a user to zoom and pan to a region of interest, learn about the stations that are there, filter the displayed stations based on observation date, weather element, observing agency, spatial location, and more.
Starting the Meteorological Data Portal
To start the MDP, browse to the appropriate web page as found in the Data Portal section of the the PCIC website. The MDP app runs in your browser.
For some regions, the app presents a disclaimer that must be accepted before it can be used to access data. Click the Accept button to accept the terms of use and enter the app proper.
The MDP’s first action is to fetch data describing all stations in its region database. This may take several seconds. During this time, the map shows a spinner and some of the selectors show “Loading…”. When all the descriptive data (metadata) has loaded, the map shows markers for each station and the selectors are populated.
Map-updating spinner
In-app info and help
Throughout the app you will find info icons ![]() next to controls
and other elements. Hover over these icons to see an immediate explanation
of the item it is next to. Often this will remove the need to refer to
this documentation.
next to controls
and other elements. Hover over these icons to see an immediate explanation
of the item it is next to. Often this will remove the need to refer to
this documentation.
Stations and histories
Each station has one or more history items associated with it.
A station history item describes a particular configuration of a station, including its name, location, and the variables it reports (which relate to the sensors installed in the station hardware). Many stations have only one history item, but some have several, reflecting small changes of location or equipment.
The distinction between station and history is often glossed over, but it does appear in things like station markers (there is one marker per unique station location, which is derived from histories) and in the metadata available on the Station Metadata tab. See below for details.
Finding and selecting stations
You find and select stations using a combination of station filtering options in the sidebar and spatial selection tools on the map.
The map is the primary display of the stations you have selected. It typically takes up much of the screen real estate, which it shares with a set of tabs that include station filtering. You can adjust the proportion of the screen allocated to the map and the tabs by using the column width controls at the top of the display.
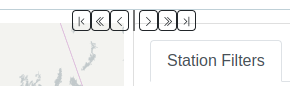
Column width controls
The main display area is divided into two columns, whose width can be adjusted in increments of 1/12 of the window width.
- To move the division one increment left or right, click the
<or>button. - To move the division two increments left or right, click the
<<or>>button. - To move the division completely to the left or right, click the
|<or>|button.
Finding and selecting stations on the map
The map shows all stations which meet the selection criteria in the Station Filters tab. A station is indicated by a circular marker at the station location. (More precisely, there is a marker for every unique station location recorded in its history records.) The colour of a station marker denotes the network it is part of. If a station has two or more unique locations, the markers for it are connected by coloured lines.
Navigating the map

Zoom controls
Zoom in: Click the zoom in ![]() icon in the upper left, double-click on the map, or roll the mousewheel forward.
icon in the upper left, double-click on the map, or roll the mousewheel forward.
Zoom out: Click the zoom out ![]() icon in the upper left, or roll the mousewheel backward.
icon in the upper left, or roll the mousewheel backward.
Pan: Click and drag the mouse pointer  on the map.
Note that zooming in to a particular area does not exclude stations which are out of your field of view from the set of selected stations. To select a spatially-limited subset of stations, you can draw one or more polygons on the map. To do so you must use one of the polygon drawing tools in the map toolbar on the left-hand side.
Drawing polygons (spatial selection)
You can draw one or more polygons on the map. Any visible (filtered) station inside any polygon is selected.

Drawing controls
![]() To draw a roughly rectangular polygon, click the
Draw a rectangle tool icon. Click and drag the mouse pointer from
one corner of your desired rectangular region to the opposite corner.
To draw a roughly rectangular polygon, click the
Draw a rectangle tool icon. Click and drag the mouse pointer from
one corner of your desired rectangular region to the opposite corner.
![]() To draw a more elaborate polygon, click the Draw a
polygon tool icon. Click on the map at each successive corner of the
polygon. Finish the polygon by clicking on the first corner again.
To draw a more elaborate polygon, click the Draw a
polygon tool icon. Click on the map at each successive corner of the
polygon. Finish the polygon by clicking on the first corner again.
![]() To edit a polygon already drawn on the map, click the
Edit shapes icon. Click and drag the corners of a polygon on the map
to adjust its shape. A rectangle’s location and dimensions can be
changed but not the rectangular shape. A general polygon can be adjusted
arbitrarily, including adding new corners by clicking “ghost” corners in
the middle of existing edges.
To edit a polygon already drawn on the map, click the
Edit shapes icon. Click and drag the corners of a polygon on the map
to adjust its shape. A rectangle’s location and dimensions can be
changed but not the rectangular shape. A general polygon can be adjusted
arbitrarily, including adding new corners by clicking “ghost” corners in
the middle of existing edges.
![]() To remove one or more polygons from the map, click the
Remove shapes icon. To remove all shapes, click Remove all. To
remove a single shape, click on it. Repeat as desired. When you have
removed all shapes you wish to remove, click Save. To cancel the
effect of removing one or more individual shapes, click Cancel.
To remove one or more polygons from the map, click the
Remove shapes icon. To remove all shapes, click Remove all. To
remove a single shape, click on it. Repeat as desired. When you have
removed all shapes you wish to remove, click Save. To cancel the
effect of removing one or more individual shapes, click Cancel.
When you add, remove or change a polygon on the map, the station count on the Station Filters tab is adjusted to reflect the stations selected. However, all stations selected by the station filters are still shown on the map so that you can adjust your polygon(s) to include or exclude particular stations.
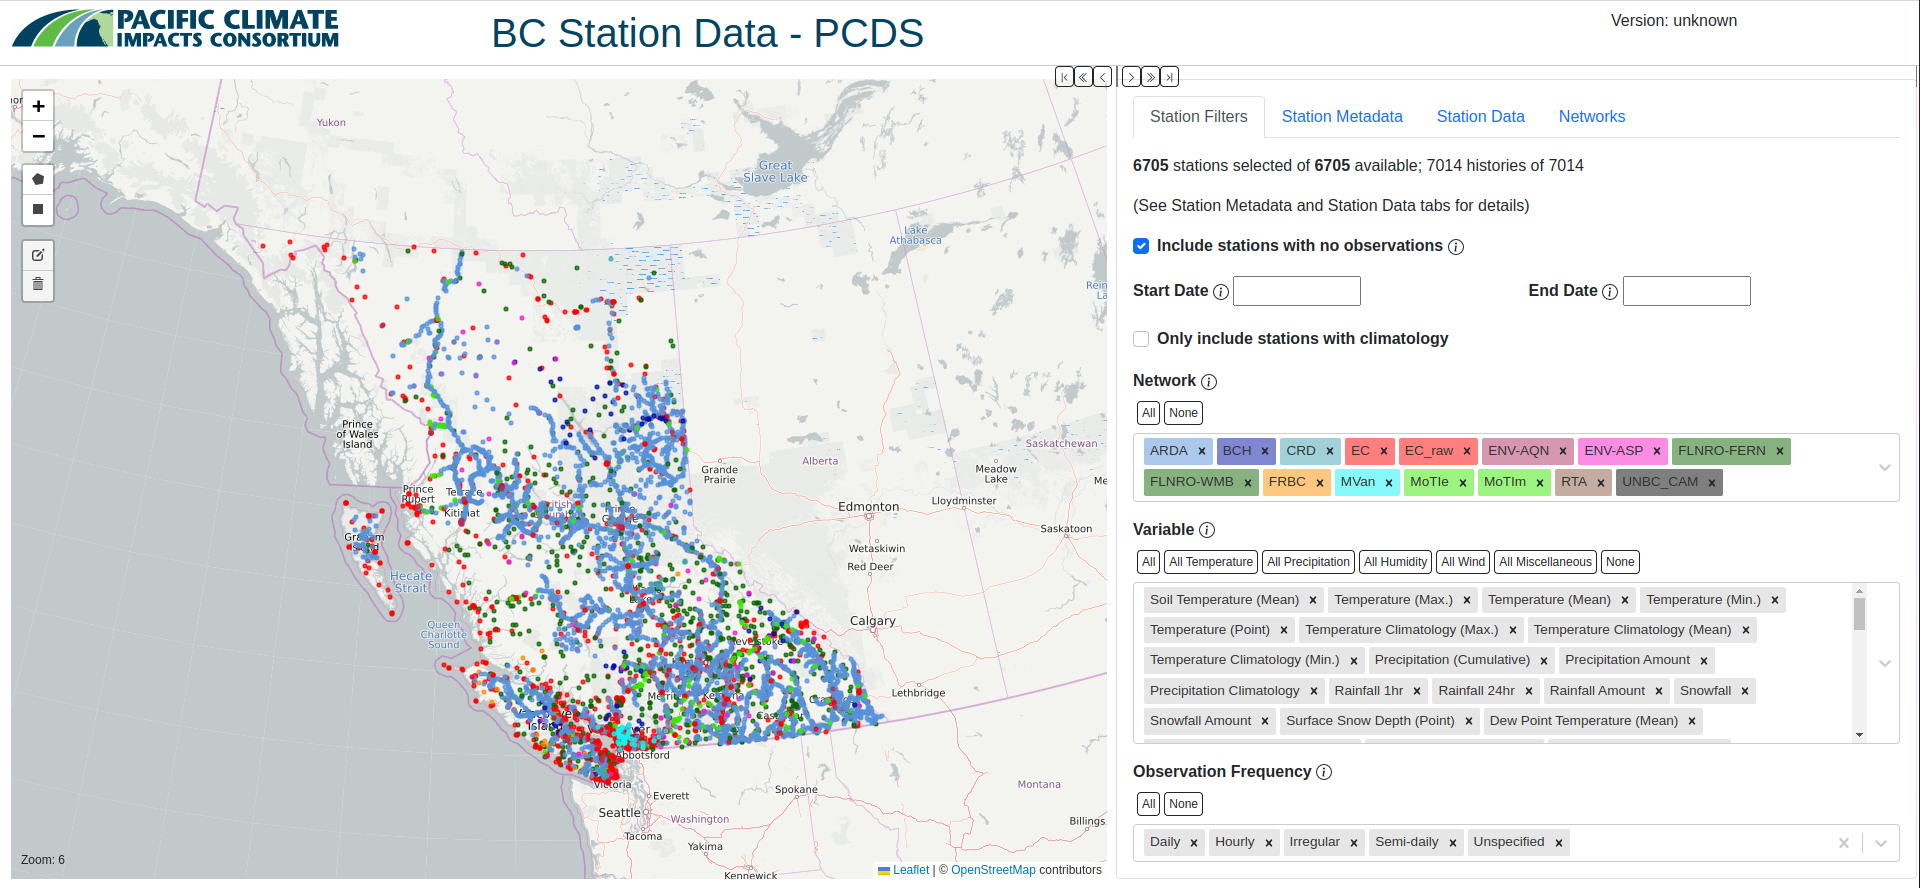
Filtering stations (Station Filters tab)
When the app starts up (i.e., the web page is loaded or refreshed), all available stations are loaded and shown on the map. To select stations by criteria including date range of available observations, the network they are part of, the variables they report, and the frequency of observations reported by the station, use the controls on Station Filters tab.
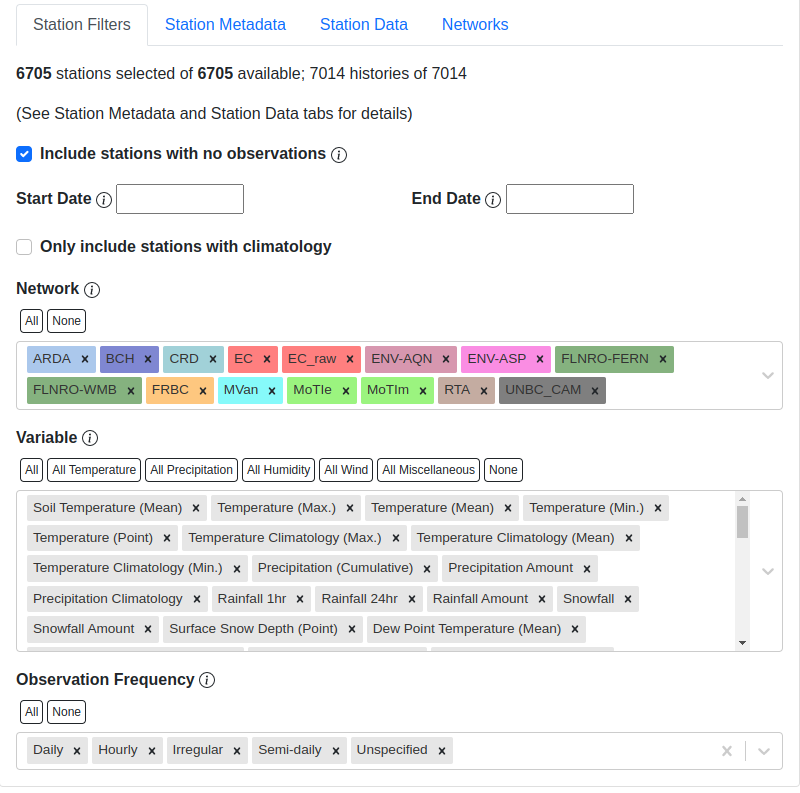
Station Filters tab
At the top of the Station Filters tab is a legend that shows the number of stations (and associated histories; see section Stations and Histories) selected by these controls and by the map polygons (see above) out of the total available.
The following controls control the filtering of stations.
Include stations with no observations: Some stations do not (yet) have observations associated with them. To select only stations having at least one observation, check the checkbox. To exclude them, uncheck the checkbox.
Start Date, End Date: Select only stations with observations within this period. Either date may be unspecified, in which case it means the earliest or latest date available, respectively. Default is empty (no filtering by date).
Only include stations with climatology: Some stations have climatology variables associated with them. (These variables are typically computed as 30-year averages from instantaneous values reported by the station.) To select only stations for which there are climatology variables, check the checkbox. Default is unchecked.
Network: Each station is part of a particular operational observation network. To select stations from particular networks, select one or more of them using the multi-select control. Default is all available stations.
Variable: Different stations report different variables. To select stations that report specific variable types, select one or more variable types using the multi-select control. Default is all available variables.
Observation frequency: Different stations report observations at different frequencies (intervals between reports). To select stations that report at specific frequencies, select frequencies using the multi-select control. Default is all available reporting frequencies.
When you change one of the station filtering controls, the station count on the tab and the markers on the map are updated to reflect the newly selected stations. The map update can take a few seconds, and all controls are frozen during the update. Please be patient.
Getting information about stations
Each station has associated with it a collection of metadata that describes it: name, location, variables reported, etc.
Metadata on the map
On the map, you can view the metadata for a single station by clicking on the station marker. A popup displaying the metadata appears. Here is an example:
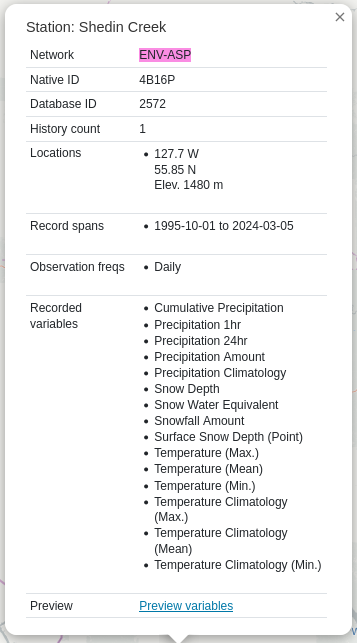
Metadata popup example
To dismiss the popup, click the X in the upper right corner.
In addition to basic metadata, the popup contains a link to the Station Preview screen which allows you to view more detail on the specific variables available on the station as well a s a subset of the observations rendered in a graphical view.
Station Preview
The Station Preview screen allows a more specific view of an individual Station history. The screen is made up of a few sections.

Preview Title example
The preview title is a collapsible section that initially shows the station name and the estimated range of available variables. Click the title to expand the section and see the stations lat/long location as well as elevation and province.

Preview Range Controls
The range controls allow you to select a date range for the observations you want to preview. This can be done in a few ways:
- Clicking the range slider will shift the range to the left or right
- Dragging the handles on the range will likewise adjust the time range
- Selecting a duration from the dropdown will change the resolution of the graphs by increasing or decreasing the number of observations shown
- Selecting a specific date from the date picker will adjust the range to that date
(The range slider control does a best effort to show the date range of available variables for a station but due to limitations in our current data does render potential gaps if a piece of data’s collection was stopped and re-started)

Preview Graphs Example
The graphs section displays a visual graph of the observations for the selected time range. Alongside the graph is a legend with basic data about the variable. This legend can be hidden by toggling the show/hide legend button in the range controls for more graph space.
Bulk metadata
Searching for stations using the map is a much easier way to find a station than is wading through a long spreadsheet of station attributes. That said, there can be substantial value and many use cases for obtaining the list of station attributes. On the Station Metadata tab, you can view and download the station attributes in a way that is dynamic and responsive your changes to the station filters.
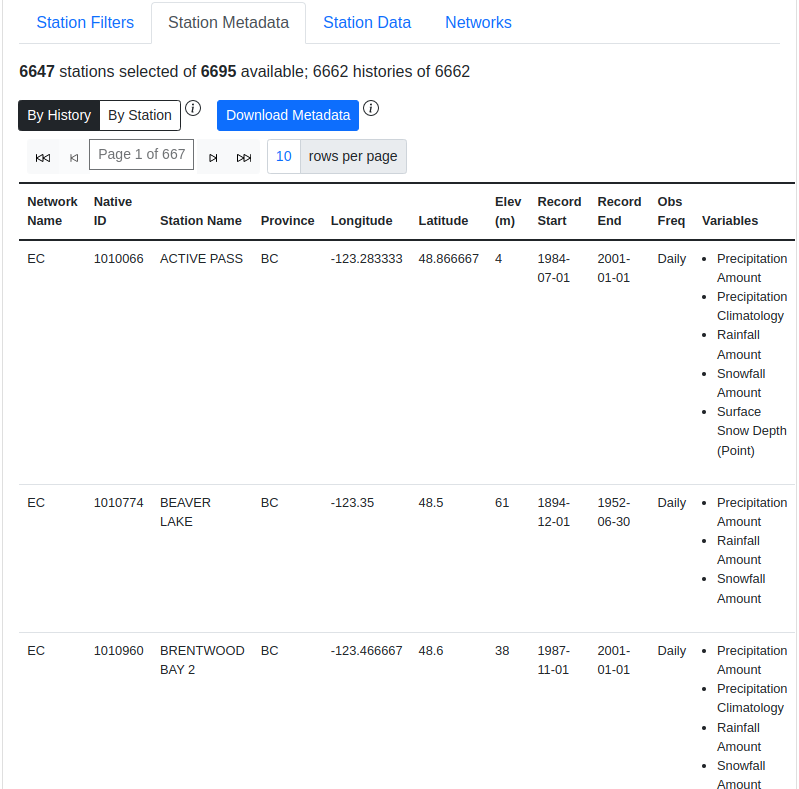
Station Metadata tab
The tab contains a datagrid that presents the metadata for all stations selected jointly by the station filters and the map polygons. As the filters or map polygons are updated, the contents of the datagrid change accordingly.
The contents of this tab can appear quite crowded; to view it with more column width, use the column width controls at the top of the column.
Station metadata can be viewed and downloaded in two formats: by history and by station. (For information on the distinction between station and history, see the section above.)
The By History format presents one history per datagrid row, repeating station information in each row as necessary. It is a less compact and readable format, but more easily mechanically processed, and it breaks out values such as latitude and longitude into separate columns. That is why it is the default format.
The By Station format presents one station per datagrid row, and rolls up information from all histories for a station into a more compact and readable form. It is however less easily mechanically processed, and combines related values such as latitude and longitude into single columns.
To see the metadata displayed in either format, click the appropriate button at the top of the tab.
The datagrid is paginated, so that only a fixed number of available records are in view at one time. Use the controls at the top or bottom of the datagrid to page through it.
The data in the datagrid can be downloaded as a CSV file at any time. To do so, click the Download Metadata button. A Save As dialog comes up. Select the name and location of the file in which to save the CSV file, and click Save.
The data in the downloaded CSV file includes all columns shown in the datagrid, plus a few extra ones that are convenient for automated processing of the data.
Downloading station data
The final step in using the data portal, downloading station data, is typically the easiest. Data download is provided on the Station Data tab.
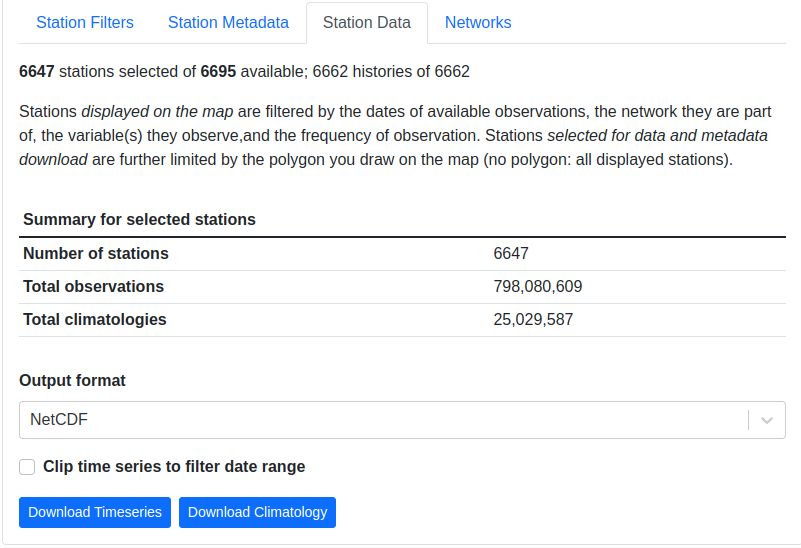
Station Data tab
This tab shows a count of the stations selected, and of the number of observations and climatologies available from those selected stations.
To download, select your desired output format, and then click either the Download Timeseries button (if you want the raw observations) or the Download Climatology button (if you want climatologies). The only additional option is a checkbox to optionally Clip time series to filter date range. If this is checked, your download will only include observations between the start date and end date that you have indicated in the station filtering options. If unchecked, you will get the full time range for all selected stations.
Networks
The Networks tab lists details of all networks, showing their colour coding on the map and a count of the stations associated with them. It serves as a legend to the map.
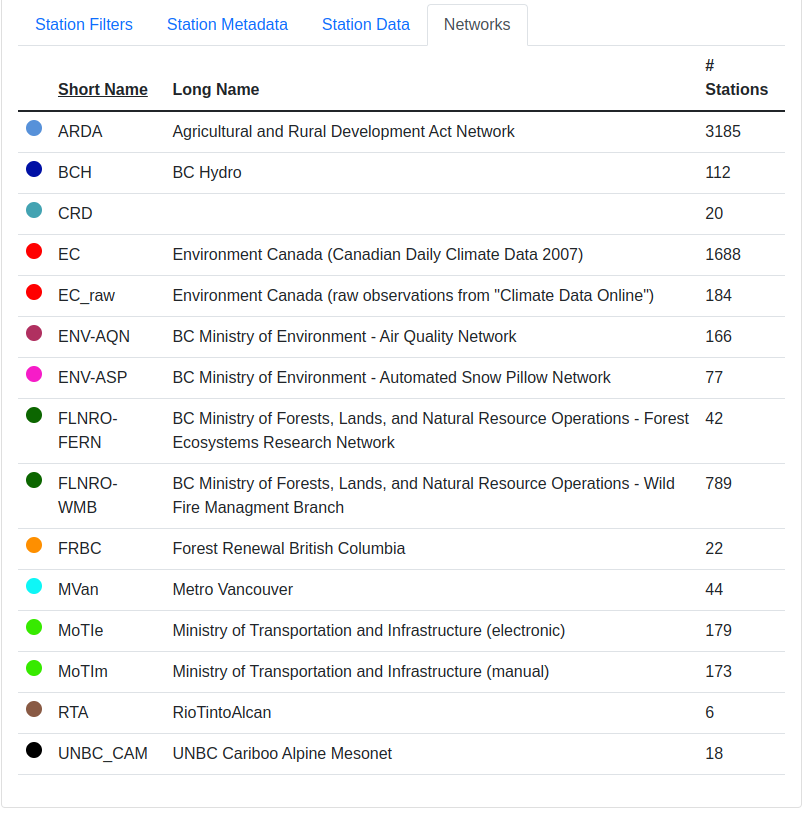
Networks tab
Unexpected behaviour
There are a few nuances to the aggregated data download that work the way the user expects most of the time, but may be unexpected in a few ways.
- Even if you zoom in the map and limit your field of view, there may be selected stations that extend beyond the field of view. Stations are selected based on your entire set of filters, and are completely unaffected by your view on the map.
- When downloading data, all variables for a selected station are included in the download regardless of whether you filter by variable. This is slightly different behaviour than is exhibited by the time selection, so it’s a point that warrants attention.
- When downloading timeseries data, if you have selected stations by drawing a polygon but have not filtered those stations by date range or meteorological variable, your selection may include stations with no data available. Files for these stations will still appear in your downloaded archive, but they will not contain any observations, only metadata and headings.
- Station Filters contains Start Date and End Date controls. These controls always limit the stations selected, but not necessarily the data downloaded. To limit the data downloaded to the filter range, check the Clip time series to filter date range checkbox on the Station Data tab.
Station Listings
If you are interested in exploring the station offerings in a hierarchical listing format (as opposed to a map), we offer a station listings interface available at the URL https://data.pacificclimate.org/data/pcds/lister
These listing pages lay out the stations in a hierarchy, splitting on raw data vs. climatology (“raw” or “climo”), CRMP network, and finally station. For example, to list all of the climatologies available for the BC Hydro network, one would navigate to https://data.pacificclimate.org/data/pcds/lister/climo/BCH/
The page for a single station includes a simple HTML page that lists all global metadata, all variables for the station, and it provides some form controls to download individual variables. Please note that you must select the checkbox for each and every variable that you want to download. None are selected by default, so clicking “Download” without any prior action will result in a bad request.
Advanced/Programmatic Usage
The whole data portal is written using open protocols and an advanced user with some scripting abilities should be able to reasonably script up a bulk download (assuming that the filters on the user interface do not cover your use case).
- The data portal speaks OPeNDAP. It should be able to generally do anything that’s
- listed in the OPeNDAP documentation, including subselections with URL query string parameters.
- You can select any number of a station’s variables. If you don’t specifically request one (or more) you get them all.
- You can select (or deselect) observations based on simple conditional comparisons (less than, greater than, equal to, not equal to).
Example 1
For your purposes of demonstration, let’s assume that a user is interested in downloading data from a whole bunch of Wildfire Management Branch stations, network code “FLNRO-WMB”. From our instance of Pydap, you can get a station listing from the data listing pages.
- If you have a list of network_name/station_ids (where station_id is the id by which it
- is called by the network, then you can patch together a URL for the full data download. For example, if you wanted to download FLNRO-WMB data for station “1002”, the URL would be https://data.pacificclimate.org/data/pcds/lister/raw/FLNRO-WMB/1002.rsql.csv
The file format extension on the end can be
csv, xls, ascii, or nc.
Example 2
Let’s say that you wanted all of the available data in ASCII format for Nelson, BC where the temperature was below freezing.
Station 1145M29, Nelson, BC, is available from the “EC_raw” network.
You could request:
If you only wanted the temperature and time variables (as opposed to all of the variables) where temperature is below freezing, you could say:
If you only wanted the freezing observations for this year you could use a temporal conditional and say:
The time format is a little tricky, because: a) You need to specify it in YYYY-MM-DD HH:MM:SS format and b) You need to put the quotes around the whole time.
Depending on what browser/client you are using, you may need to URL encode all of that syntax, but so far all of the browsers tested will do the translation for you.
For example:
becomes: